

Facebook reach has continually declined over time.
Nowadays everyone tells me there is no point in even sharing content on Facebook.
But you know what? You can still generate traffic from Facebook.
Yes, traffic has declined. Even so, in the last 31 days, I’ve generated 20,420 visits from Facebook.

That’s not too shabby considering I’m only publishing 4 articles a month. That’s an average of 5,105 visitors per article from Facebook.
And because I’ve been building the ultimate SEO tool, I’ve been gathering social sharing data on over 9 billion URLs.
But a large portion of the URLs in our database aren’t articles. So, for this analysis, we looked at 5,860,631,392 articles.
Before I dive into what we have learned, there are few things you ought to know about the data:
- Technically we have gathered social sharing data on 11,721,262,784 articles. For each URL we gather data on the HTTP and the HTTPS version to get an accurate count as more sites have transitioned to HTTPS over time.
- We only looked at articles. A lot of URLs such as nike.com have over a million Facebook shares, but they aren’t articles.
- We looked at articles in multiple languages as English isn’t the main language everyone speaks in the world.
- When I say “social shares”, that includes reactions, comments, and shares from Facebook.
- We excluded scraper sites. A lot of the articles shared on Facebook are scraper sites. They barely have any shares and it skews the data.
- In total, the 5,860,631,392 articles came from 163,968,722 domains.
- Our list of articles started with Google search results. Because we have data on 507,348,976 search engine results from 64 different countries, we were then able to find the sites that you read on a regular basis, which then helped us crawl and find more articles that you may read.
Let’s dive into the learnings.
What type of content generates the most Facebook likes overtime?
There’s been countless articles published showing that list posts and infographics generate the most social shares.
And that makes sense because who doesn’t love a visual piece of content such as an infographic?
But what if you want social shares over time?
By looking at how many social shares each article generates on a monthly basis, we were able to see the growth rate and the types of article that generate the most social shares over time.
Here’s the share growth rate over time per article type:
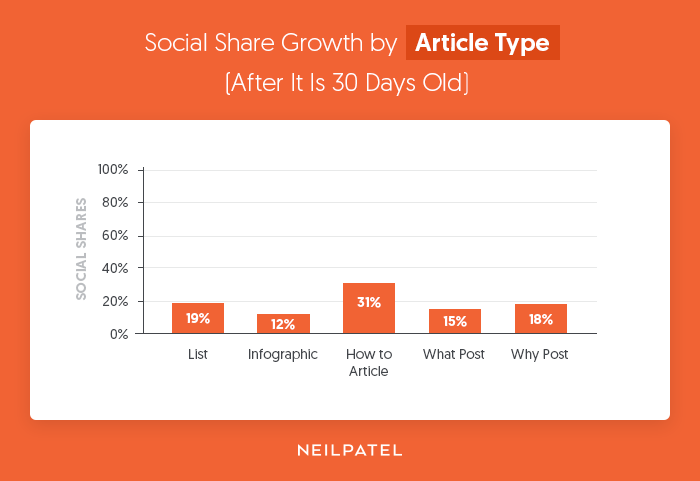
If you want a quick boost in Facebook traffic, consider creating infographics.
But if you want more consistent Facebook traffic each and every month, focus on “how to” articles. They don’t do as well right off the bat, but over time they produce more consistent Facebook traffic.
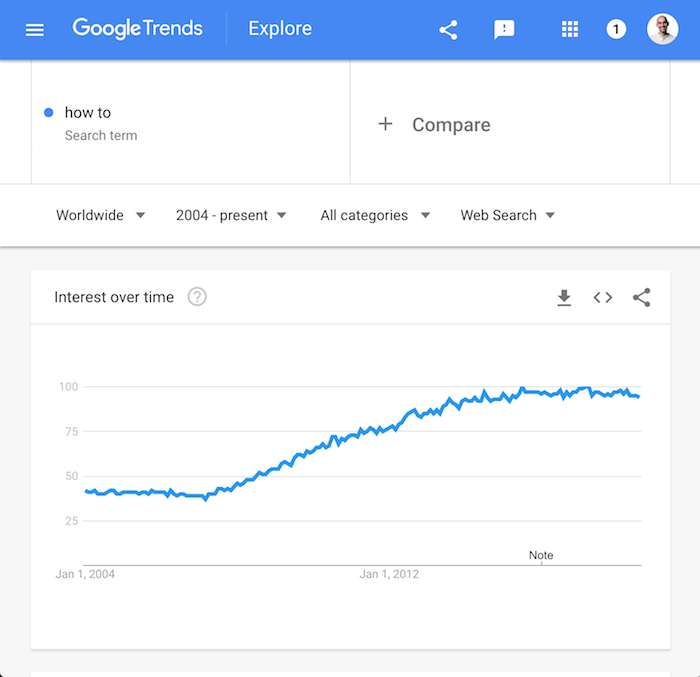
The reason for this is that infographics are harder to rank on Google because they don’t contain a lot of text.
By creating content like “how to” articles that tend to get searched frequently, you can get consistent traffic to your articles which will cause more social shares.
How long (or short) should your headlines be?
Do Facebook users prefer short or long headlines? If you had to take a guess, what would you think?
Most people think the shorter the better…
Let’s look at the data:
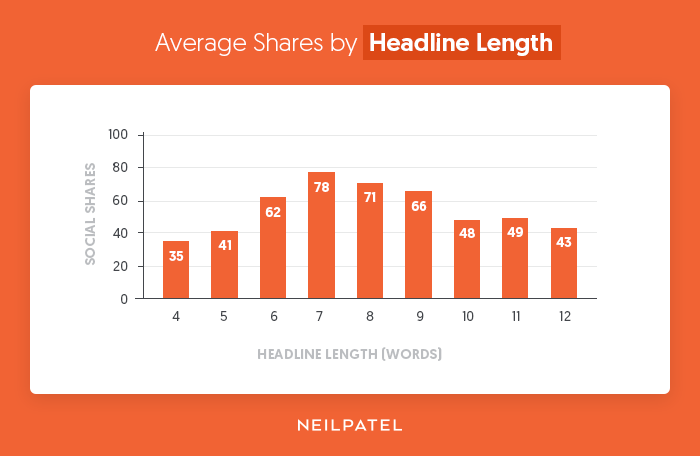
Users prefer headlines that are roughly 7, 8 or 9 words.
You can’t really explain what an article is about in 4 words. By having your headline long enough, it will allow you to be more descriptive.
Don’t focus on making your headlines as short as possible, focus on making them descriptive.
How do images impact shares?
You already know people love images. If they didn’t, Facebook wouldn’t be as popular.
But the question is, how many images do you really need per article to get the maximum number of social shares?
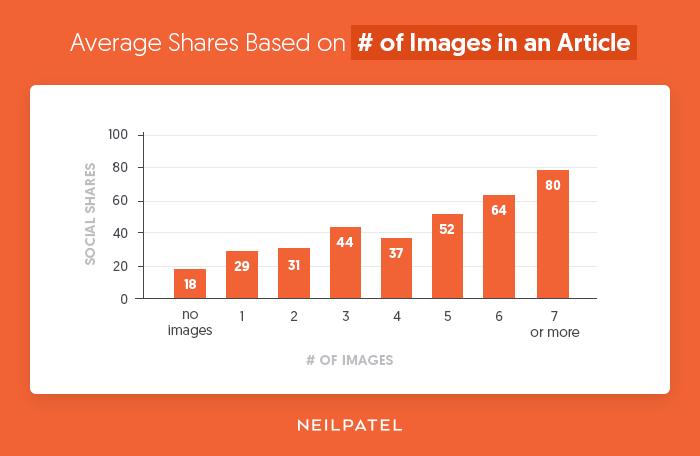
In general, the more images the better.
The one thing to note is that a lot of the articles that had over 7 images weren’t really articles per say.
A lot of them were articles that have a clear objective of getting you to browse through an image gallery, such as someone showing off stunning images of the Milky Way or image galleries of silly cats.
When writing content, consider including images to describe your message. The more the better.
How long should your lists be?
Based on our data, most people prefer writing list-based articles with the number 10. In other words, their lists only have 10 items.
When we looked at the average share count based on list size, it was clear that lists that were 10 items long won.
But there is a problem: the data is skewed because everyone focuses on smaller lists.
When we started to look at the median share count per list size, the data got interesting.
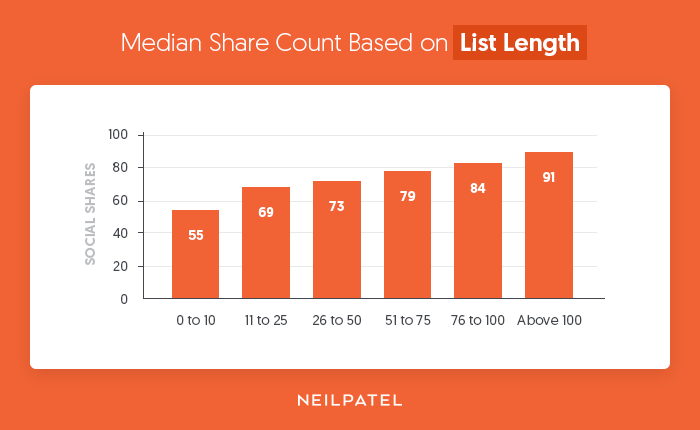
The more detailed the list, the better.
If you ever decide to write a list-based post that is over 100 items, there is a good chance people will share it assuming it is super detailed.
Shortlists have been beaten to death for years. That’s why longer ones that leverage the skyscraper technique perform better these days.
How long should your articles be?
Should you write short articles or long ones? And how sort or long should they be?
This question has been asked and discussed in marketing circles for years.
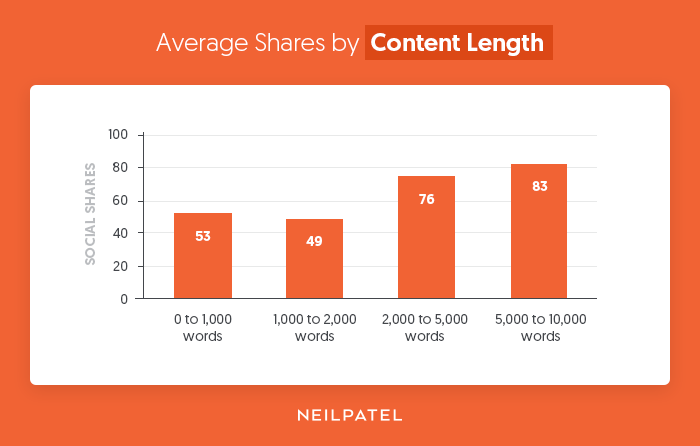
The data shows, the longer the better.
If you were to write 10,000-word blog posts that are super actionable, you would generate more social shares than if you wrote 2,000-word blog posts.
I know I’ve mentioned in the past that writing super long content is like throwing money out the window. And it is especially true when it comes to Google traffic.
So for a nice balance, I would still stick with the advice I gave in that article, which is to write roughly 2,000-word blog posts. Then expand upon it over time. And every time you expand upon the article, you can share it again on Facebook.
If you don’t care about Google and you only want to focus on Facebook, then just go for that 10,000-word article.
You’ll also notice that 1,000-word articles generate more shares than 2,000-word articles.
We were curious why this was so we dug into the data a bit more and found that articles that contained less than 1,000 words in many cases contained more images than 2,000-word articles.
In addition to that, many of the shorter articles were also news based.
And speaking of news…
Is it better to write news-based content or evergreen content?
Over time, evergreen content gets more traffic. It’s not just because of Facebook, it’s that they rank better in Google and get more consistent traffic over the years.
No one is Googling about what happened in the news a year ago.
None-the-less, let’s look at the first hour of when an article is published.
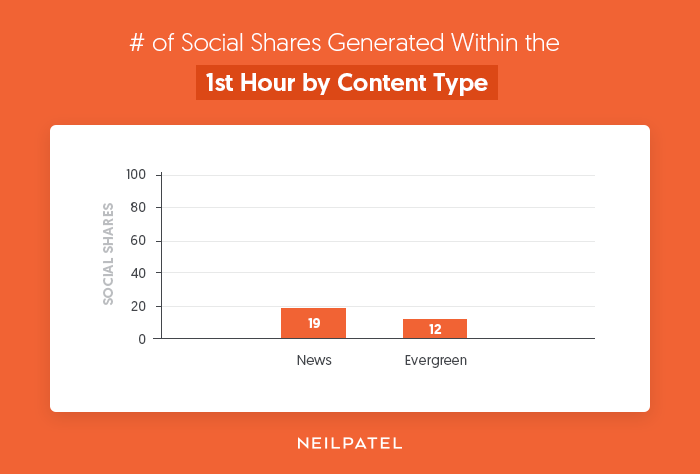
News based articles win in the short run. I already discussed above how “how to” articles will get you the most consistent search traffic over time, but if you want a quick hit, consider covering news related topics.
Do emotions affect social sharing?
I used to love writing articles that pushed fear because they generated a lot of traffic for me. But the issue with doing this is that I used to get emails from people asking me if I was depressed or needed help.
I’ve always been fine, but many of you told me how you don’t like when I push fear in my articles. So, I naturally stopped.
And although fear is an effective way to generate more social shares, it isn’t the most powerful emotion (at least when it comes to Facebook).
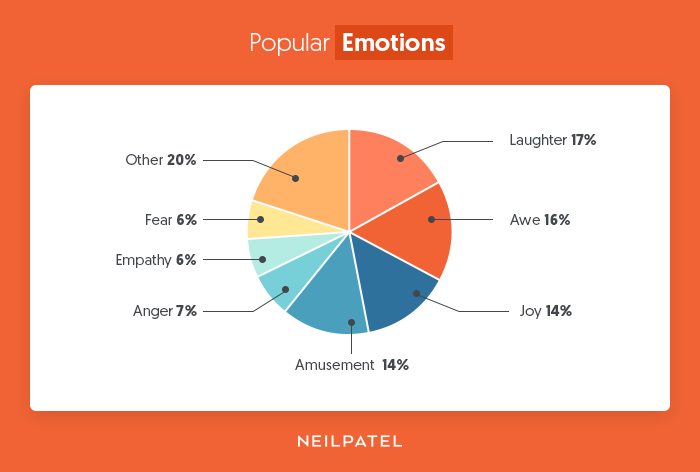
People love content with laughter, awe, and joy. Or at least, that’s what people prefer sharing, as opposed to fear.
You can clearly see by the image above that people prefer laughter roughly 3 times more than they prefer fear.
When should you post your content?
Writing an amazing article isn’t enough. If you write content on a bad day and release it during a time when no one is online, then you won’t go viral on Facebook.
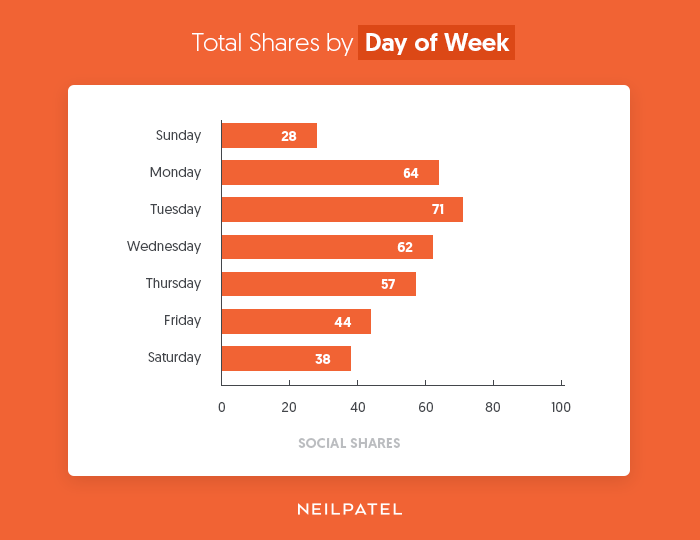
People prefer sharing content on Tuesday over any other day.
If you are going to write only one article a week, release it on Tuesday. If you are writing multiple articles a week, focus on Monday, Tuesday, and Wednesday as they are the most popular days.
And as for the time of day…
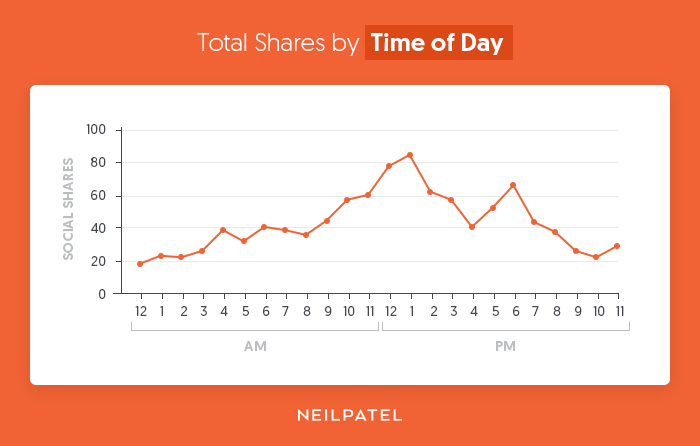
You tend to share content between 11 am and 1 pm.
That’s right before you are about to leave for your lunch break and it’s right when you come back. A lot of people get tired during the middle of the day and they need a break.
That’s why you will see many people within your office on Facebook during the afternoon.
If you miss the 1 pm publishing window, you can always shoot for the 6 pm slot. The share count goes back up around the time people are finishing up with work.
Conclusion
Yes, it is hard to get traffic from Facebook. They do limit your reach compared to 4 or 5 years ago because they don’t want you driving people from Facebook off to your website. That and they want you to boost posts to increase your reach (and their revenue).
The longer people stay on Facebook the more money they make. That’s why they love video content.
But that doesn’t mean you still can’t do well. If you follow the data above it will give you the best shot of getting the most traffic from Facebook.
What do you think about the data and stats? Are you going to follow it?
The post We Analyzed 5,860,631,392 Articles From 64 Countries. Here’s What Facebook Loves! appeared first on Neil Patel.


from Blog – Neil Patel https://ift.tt/2NcSr9Q
from WordPress https://ift.tt/2CgFzeA
No comments:
Post a Comment